
LookARail

Seeing the system before changing it
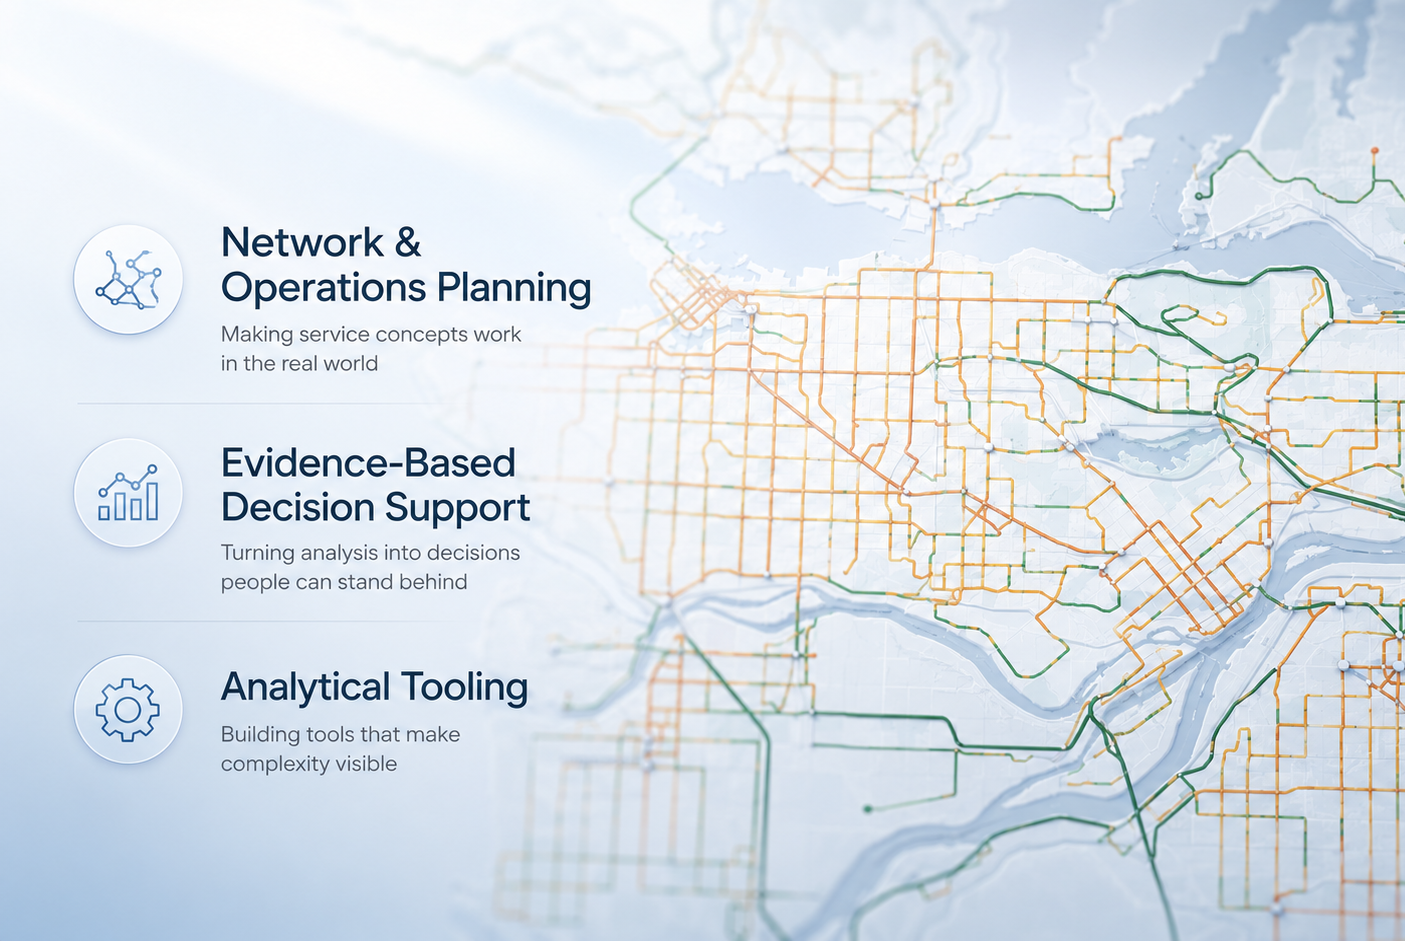
Portfolio graphic showing network and operations planning, evidence-based decision support, and analytical tooling over a transit network map.
Luke Li working at a table during a collaborative workshop.

Luke Li

Making complex systems easier to see

I work across rail operations planning, transit analytics, simulation, traffic operations, and public-data tools. My focus is making technical questions easier to inspect before decisions become expensive to change.

01

Network & operations planning

Specialized in developing service concepts, timetables, fleet plans, and concept of operation

02

Evidence-based decision support

Using historical data, forecast, and calibrated models to inform the benefits and costs of major infrastructure decisions

03

Analytical tooling

Specialized in creating customized tools, dashboards, and workflows that exposes bottlenecks and opportunities

Tools

A couple of things I have built.

TransitBunny and TransitBunny RT are the clearest examples on the site of how I like to turn technical data into readable interfaces.
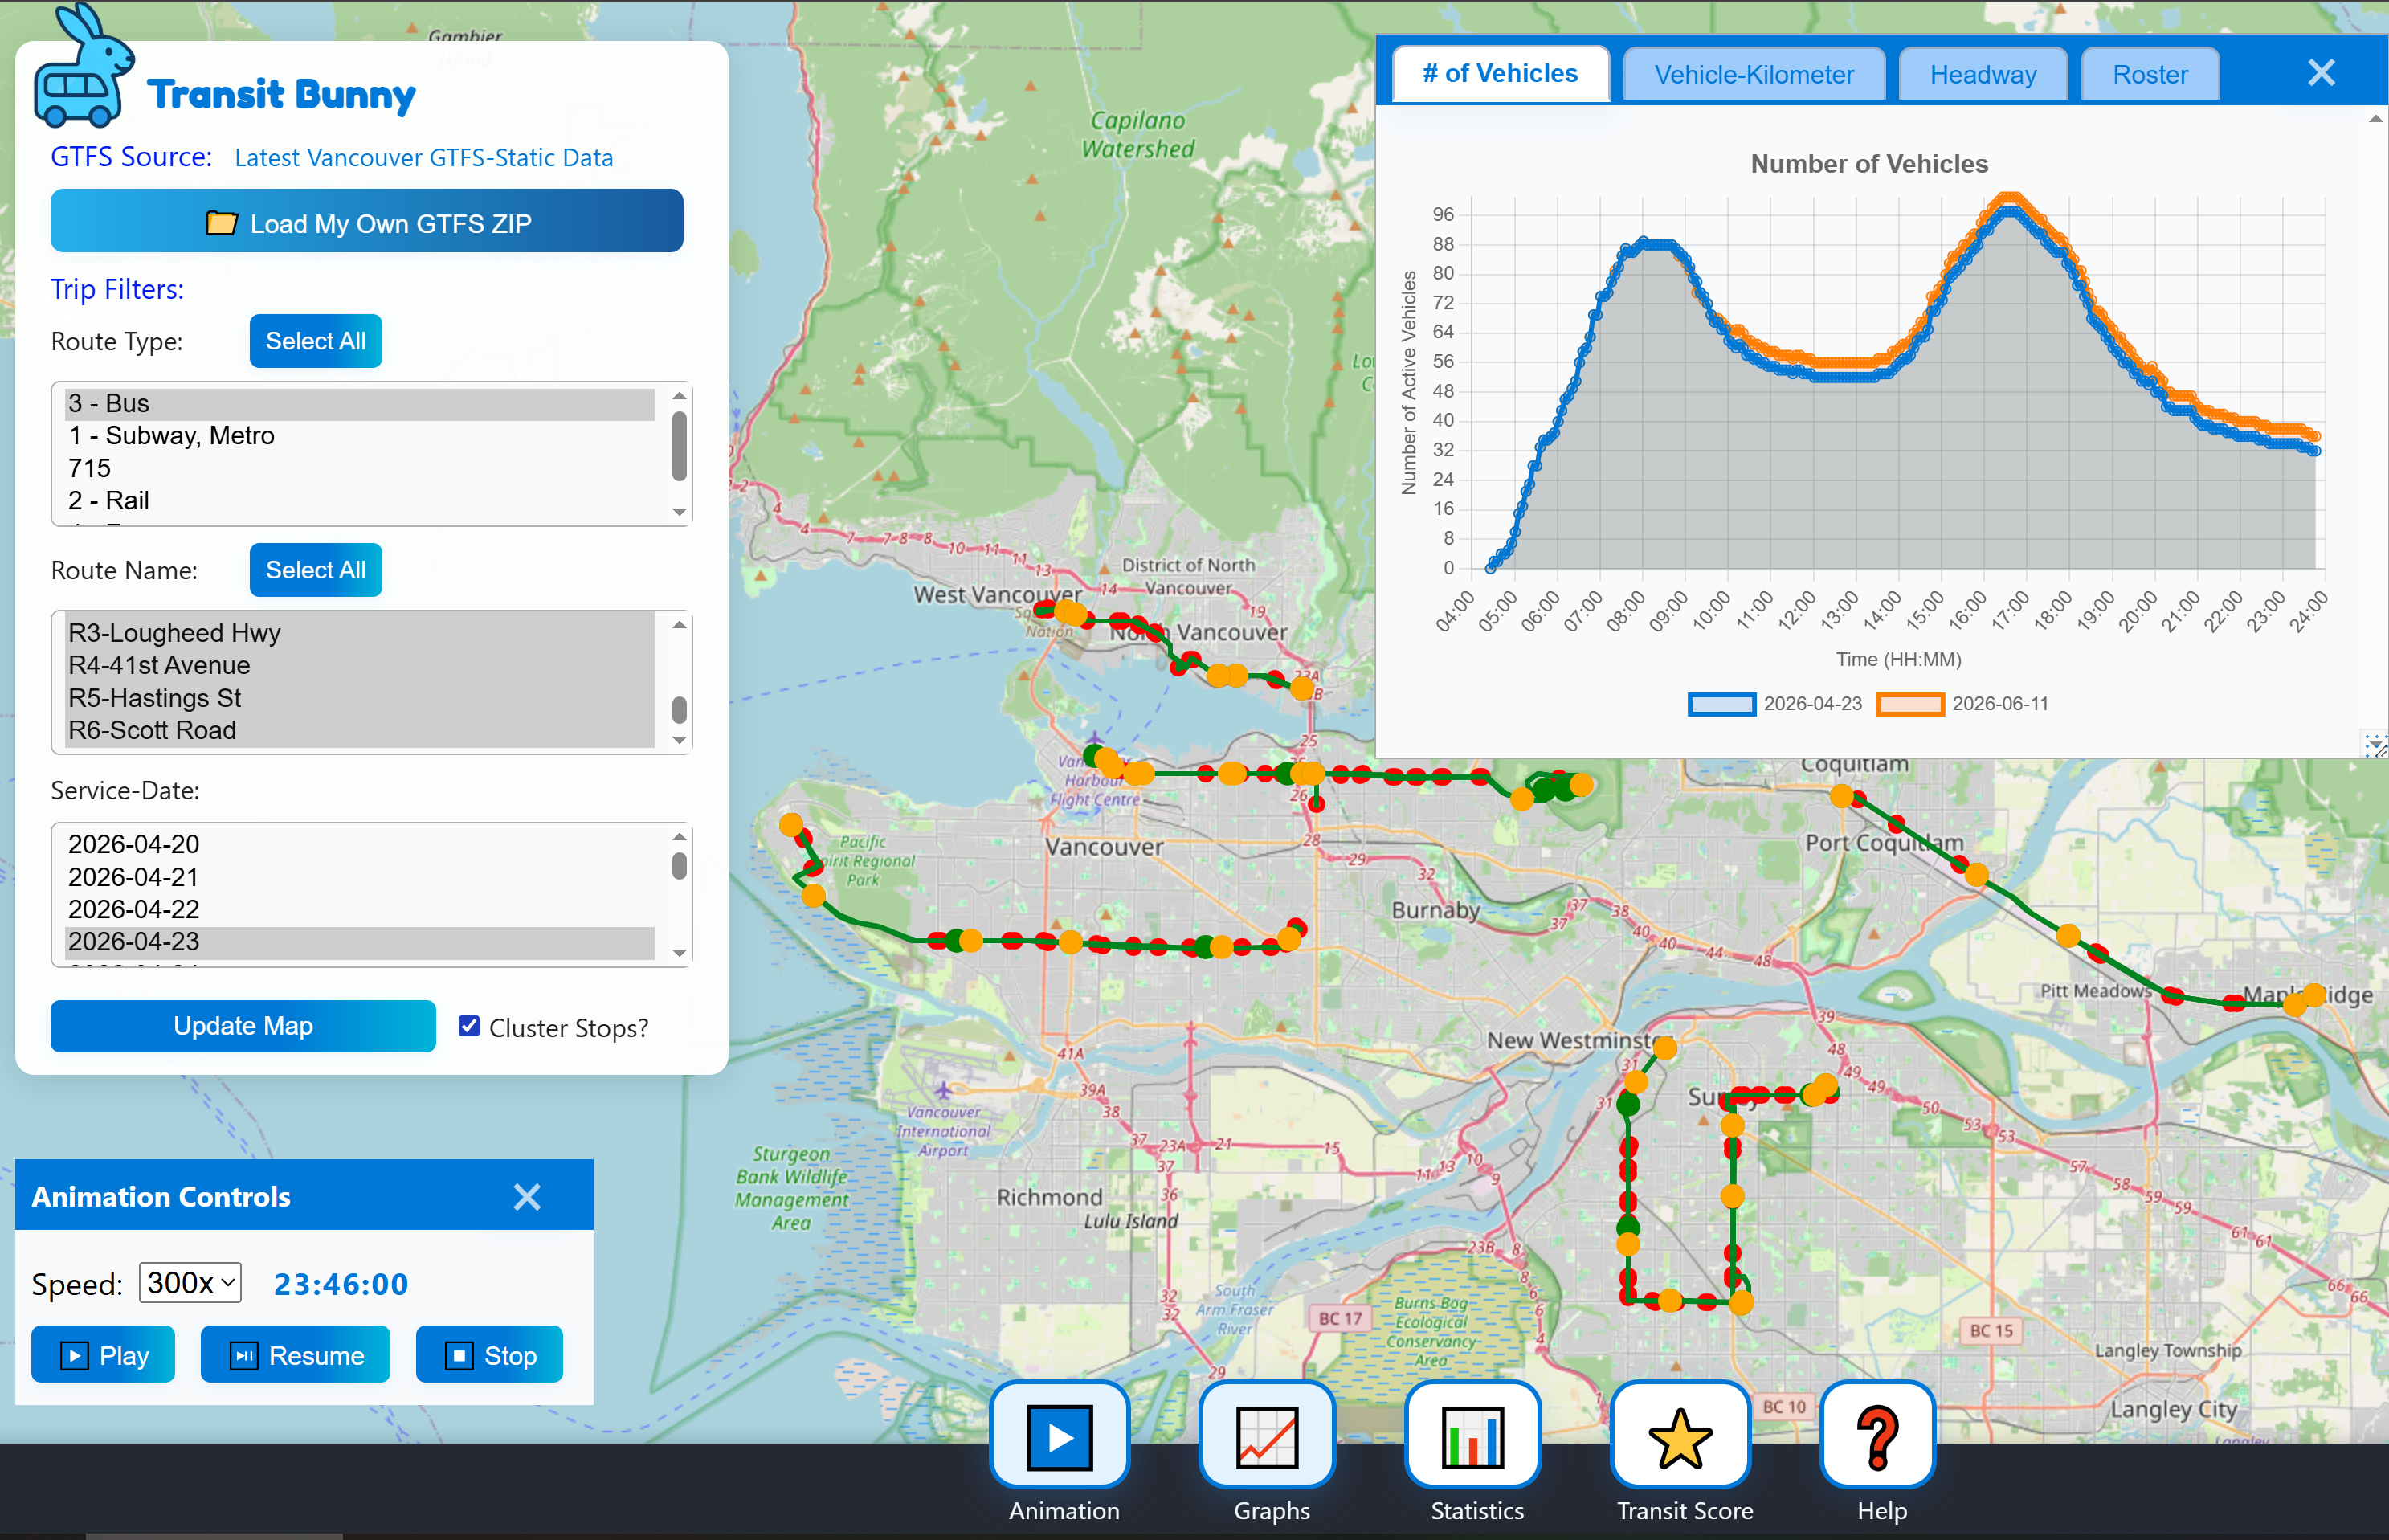
TransitBunny interface preview

Static GTFS exploration

TransitBunny

TransitBunny helps you unpack any static gtfs data into useful insights. It turns schedule files into route views, service patterns, charts, statistics, and schedule-based animation.
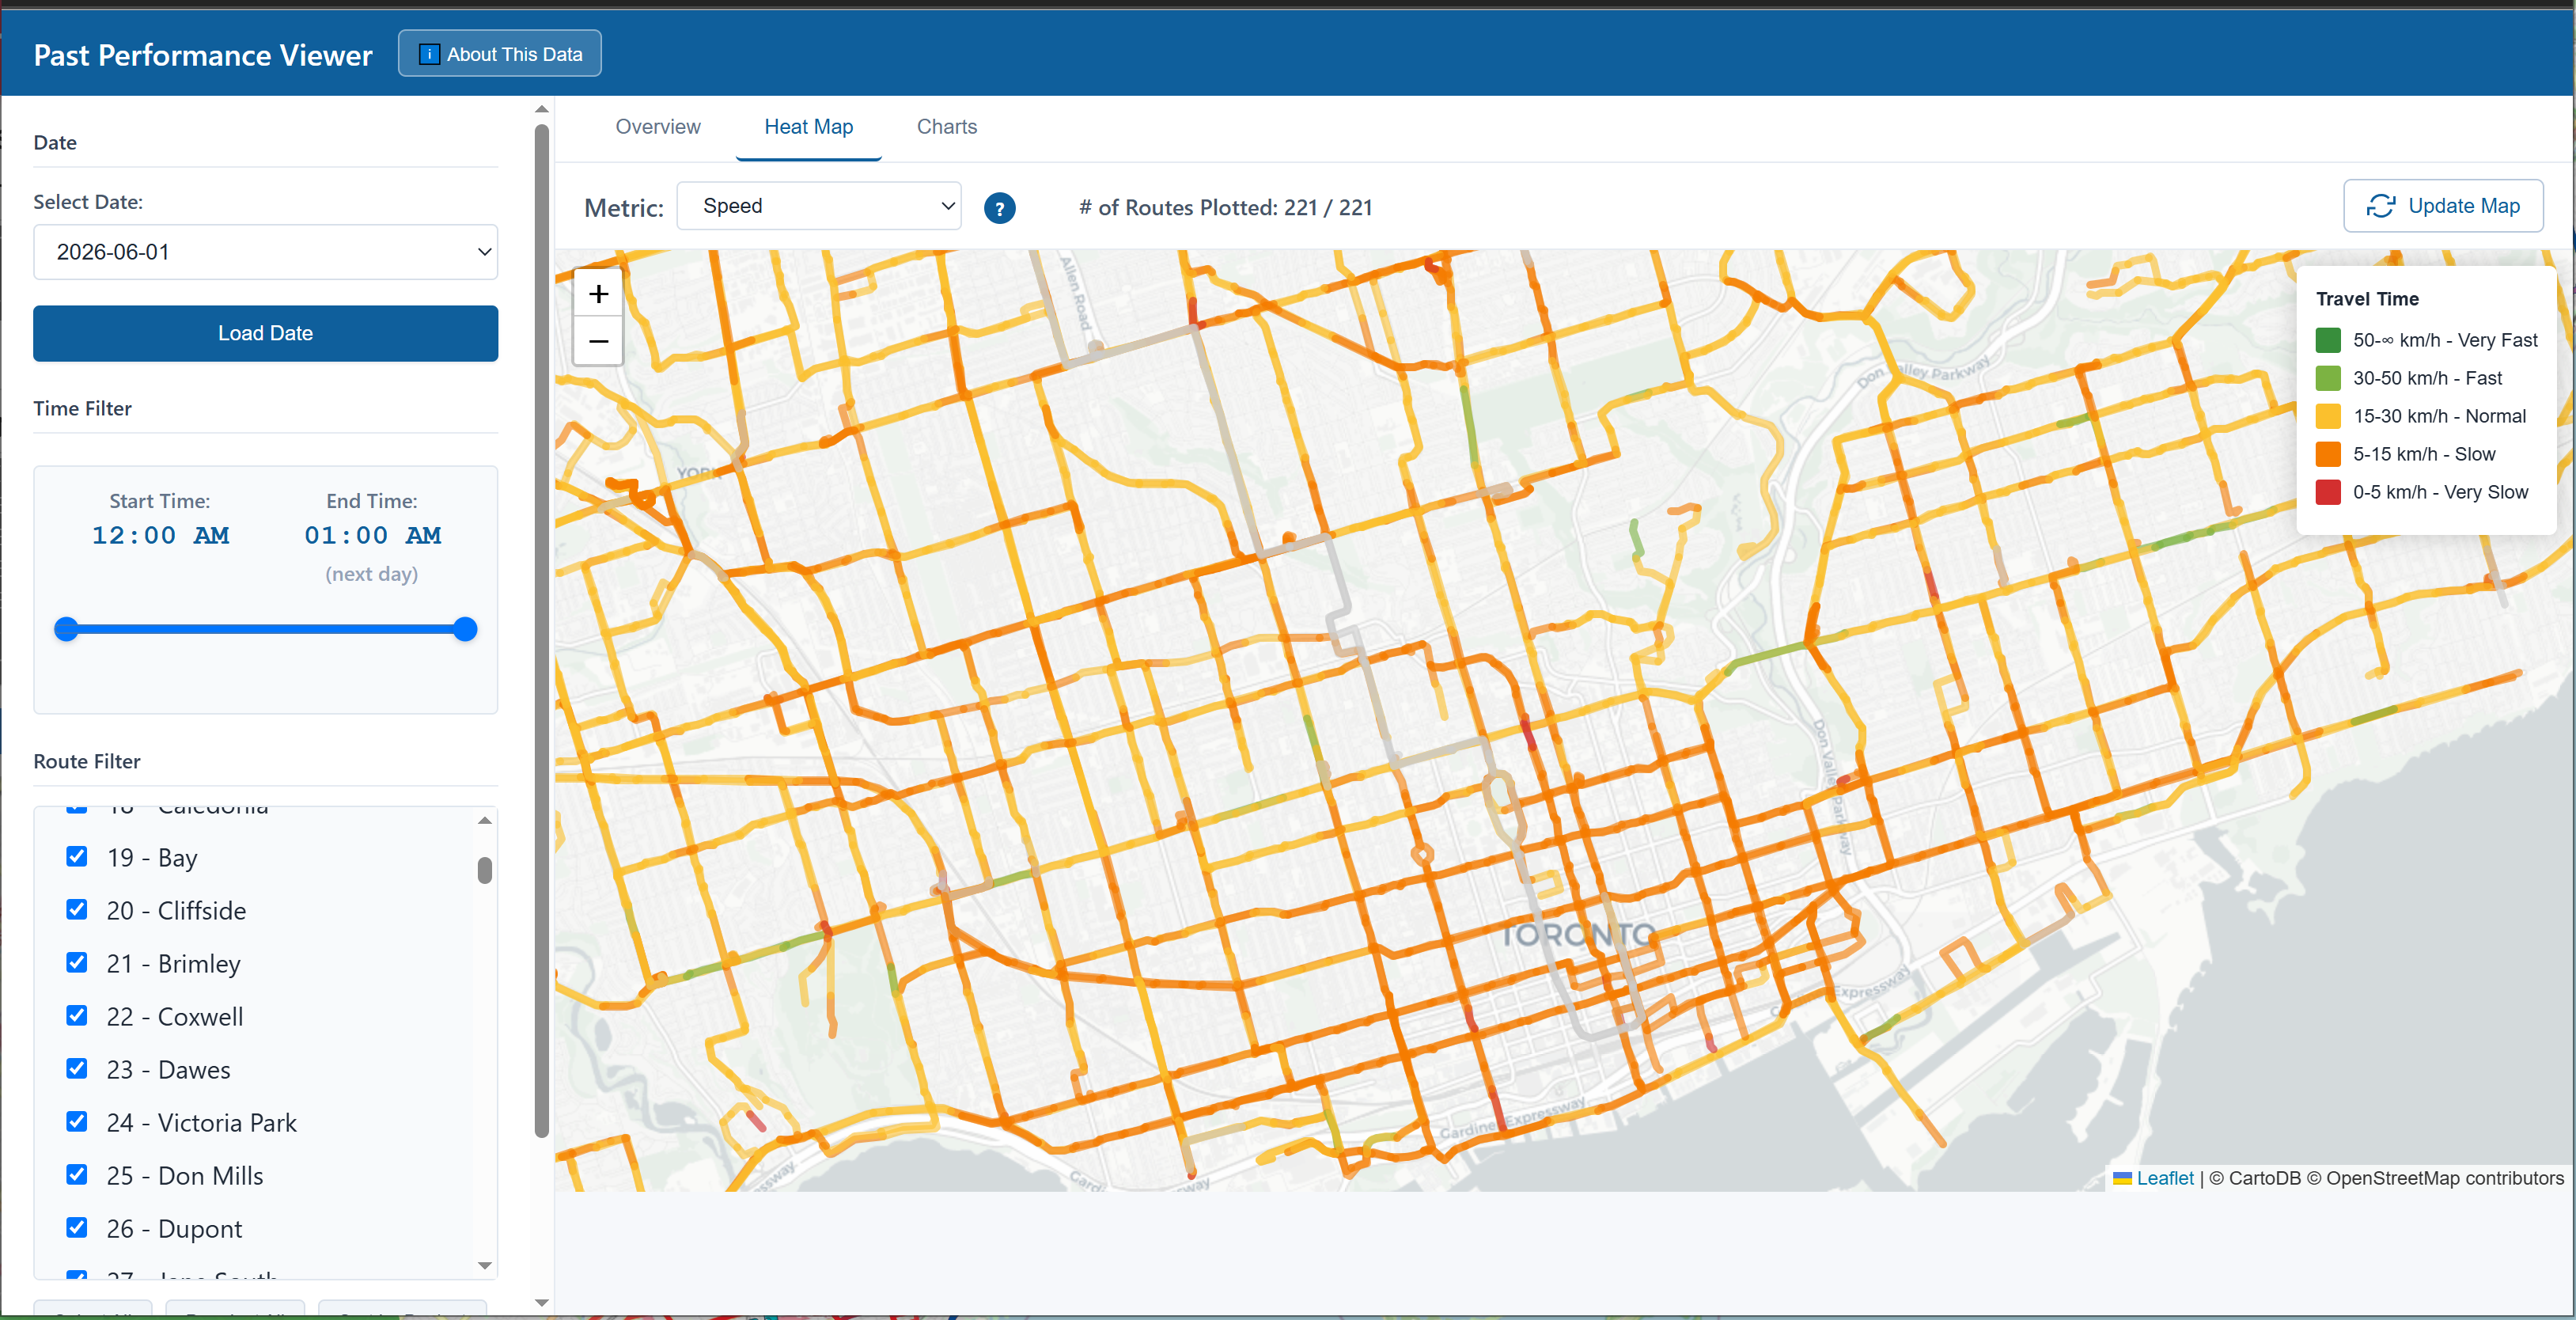
TransitBunny RT interface preview

GTFS-Realtime exploration

TransitBunny RT

TransitBunny RT records past transit performance for Vancouver and Toronto, and visualize them into useful metrics such as on-time performance, speed, reliability, headway regularity, etc..