
Data is only useful when people can see what it means
So I build tools that make complex systems visible, comparable, and easier for more people to understand
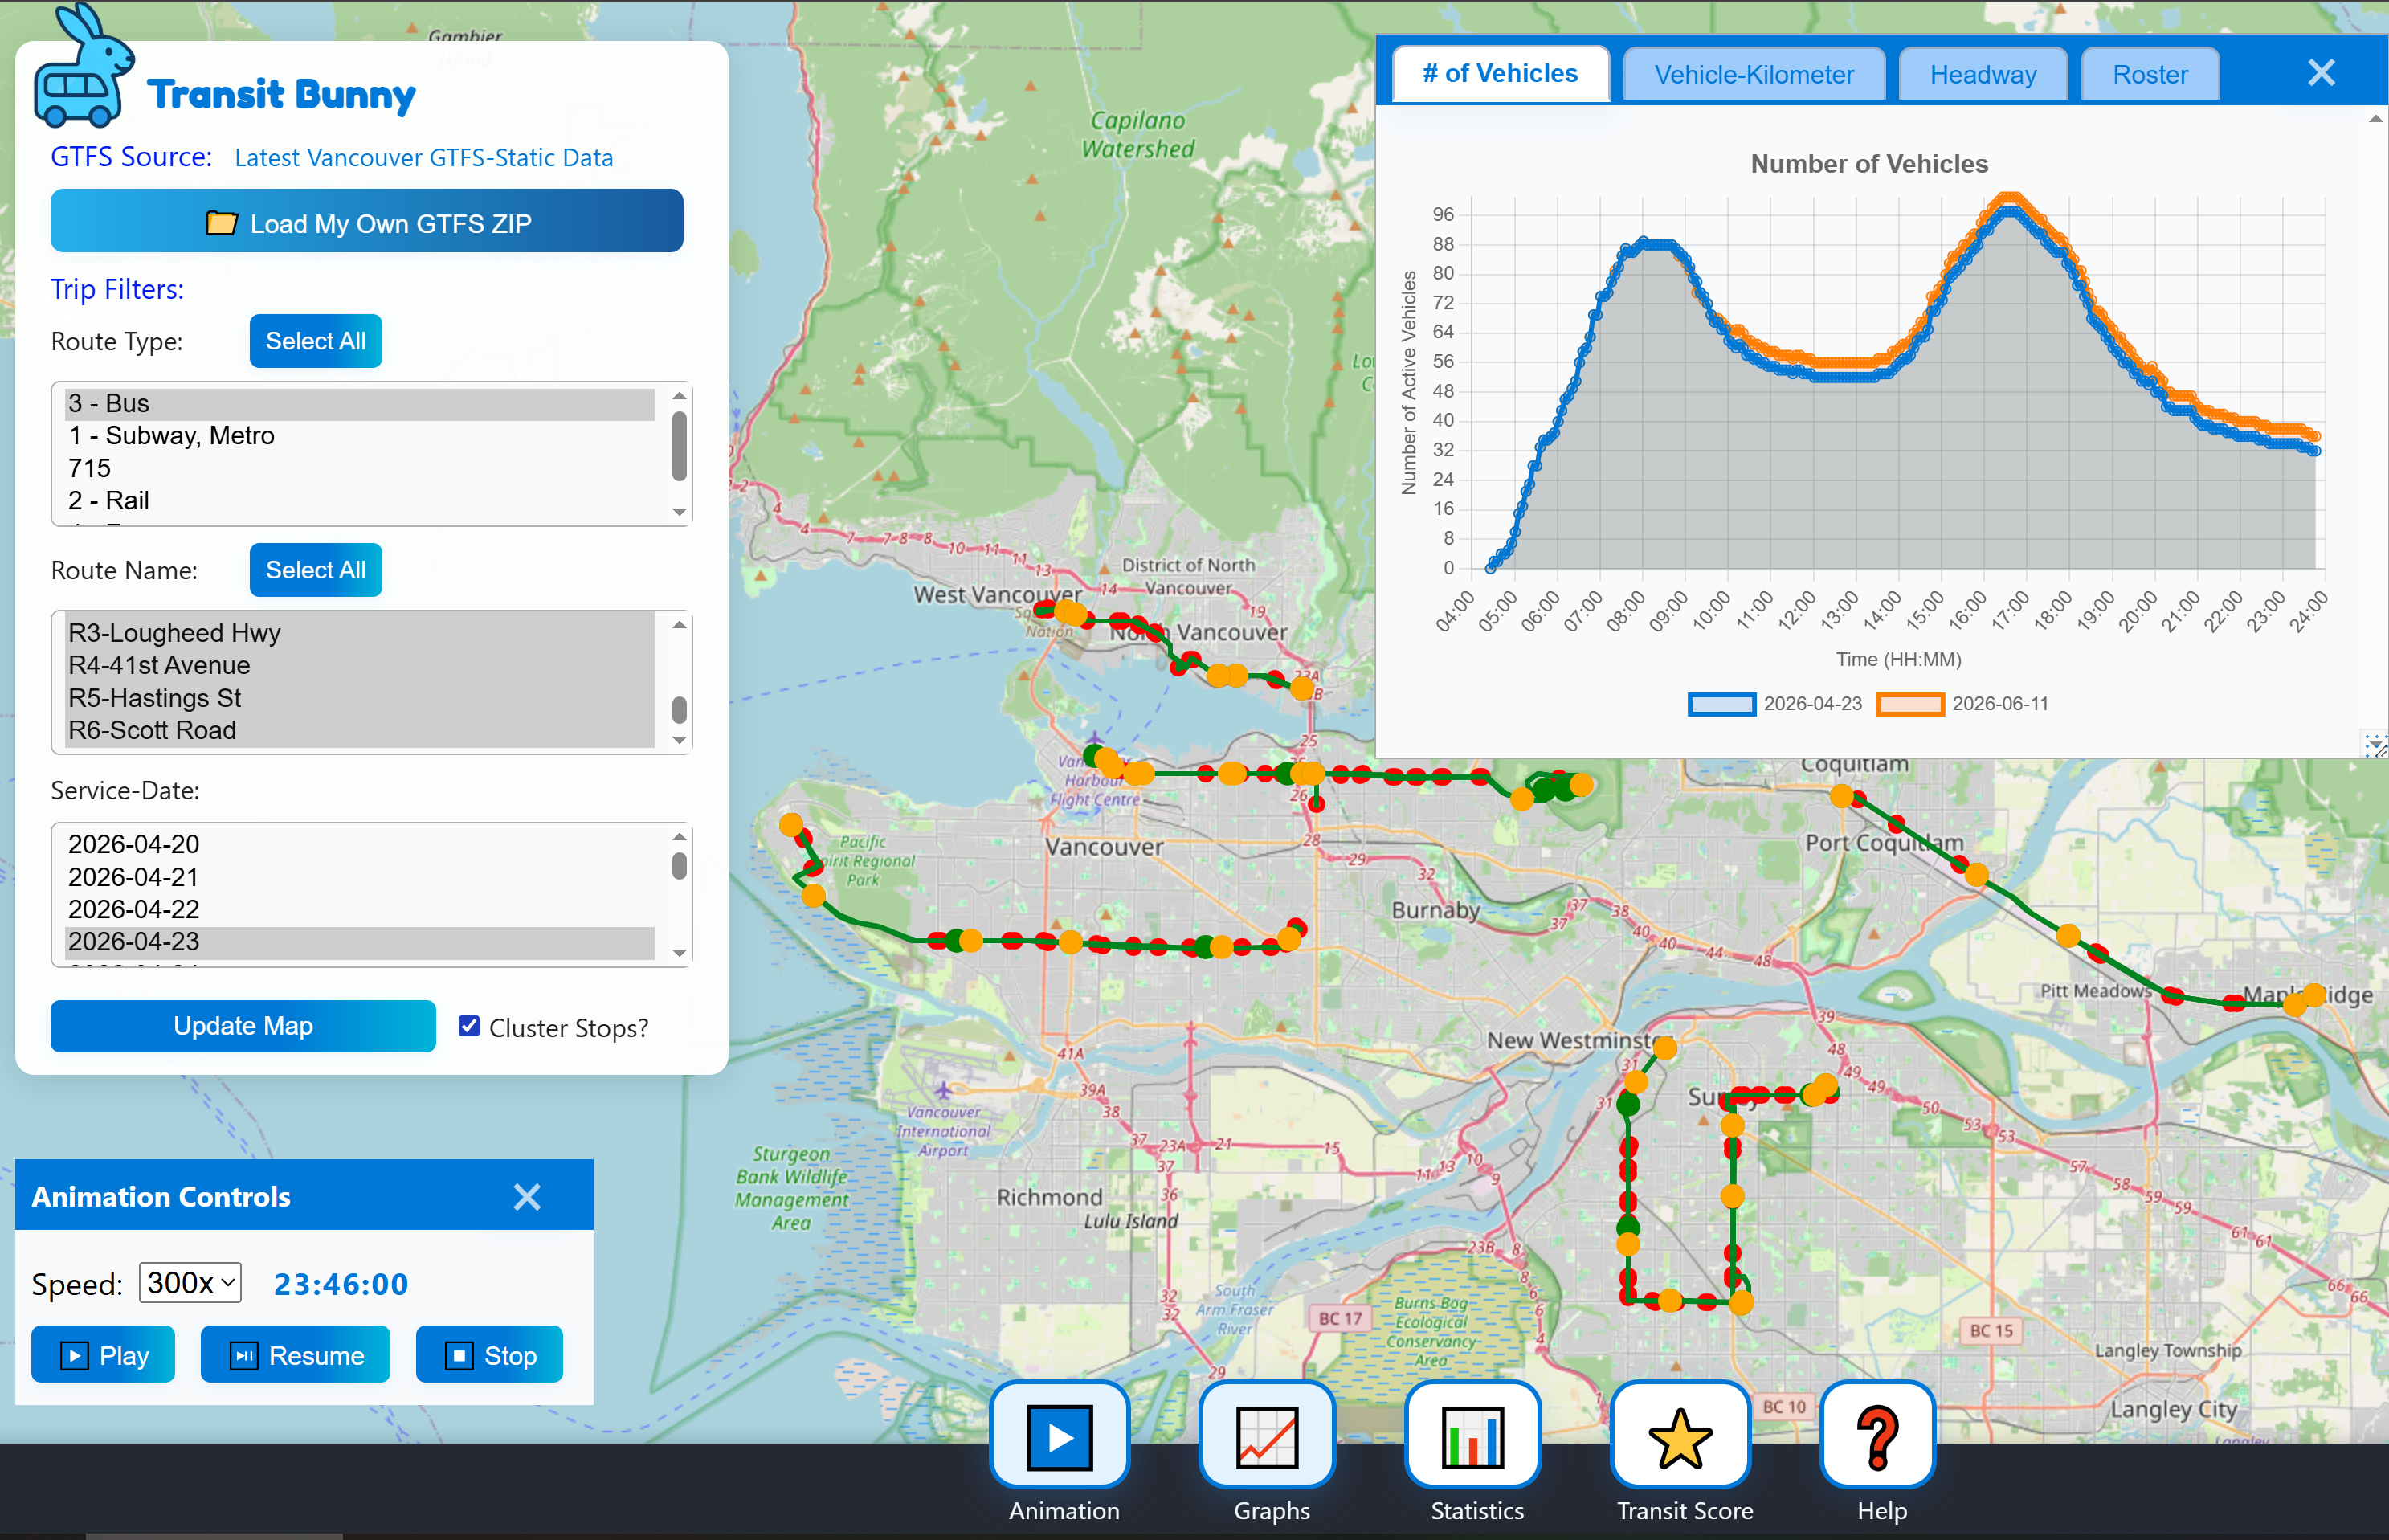
TransitBunny
TransitBunny helps you unpack any static GTFS data into useful insights. It turns schedule files into route views, service patterns, charts, statistics, and schedule-based animation.
Features
- Visualize or extract route-level statistics
- Compare Services Before vs After Changes
- Service Pattern Review
- Schedule Animation
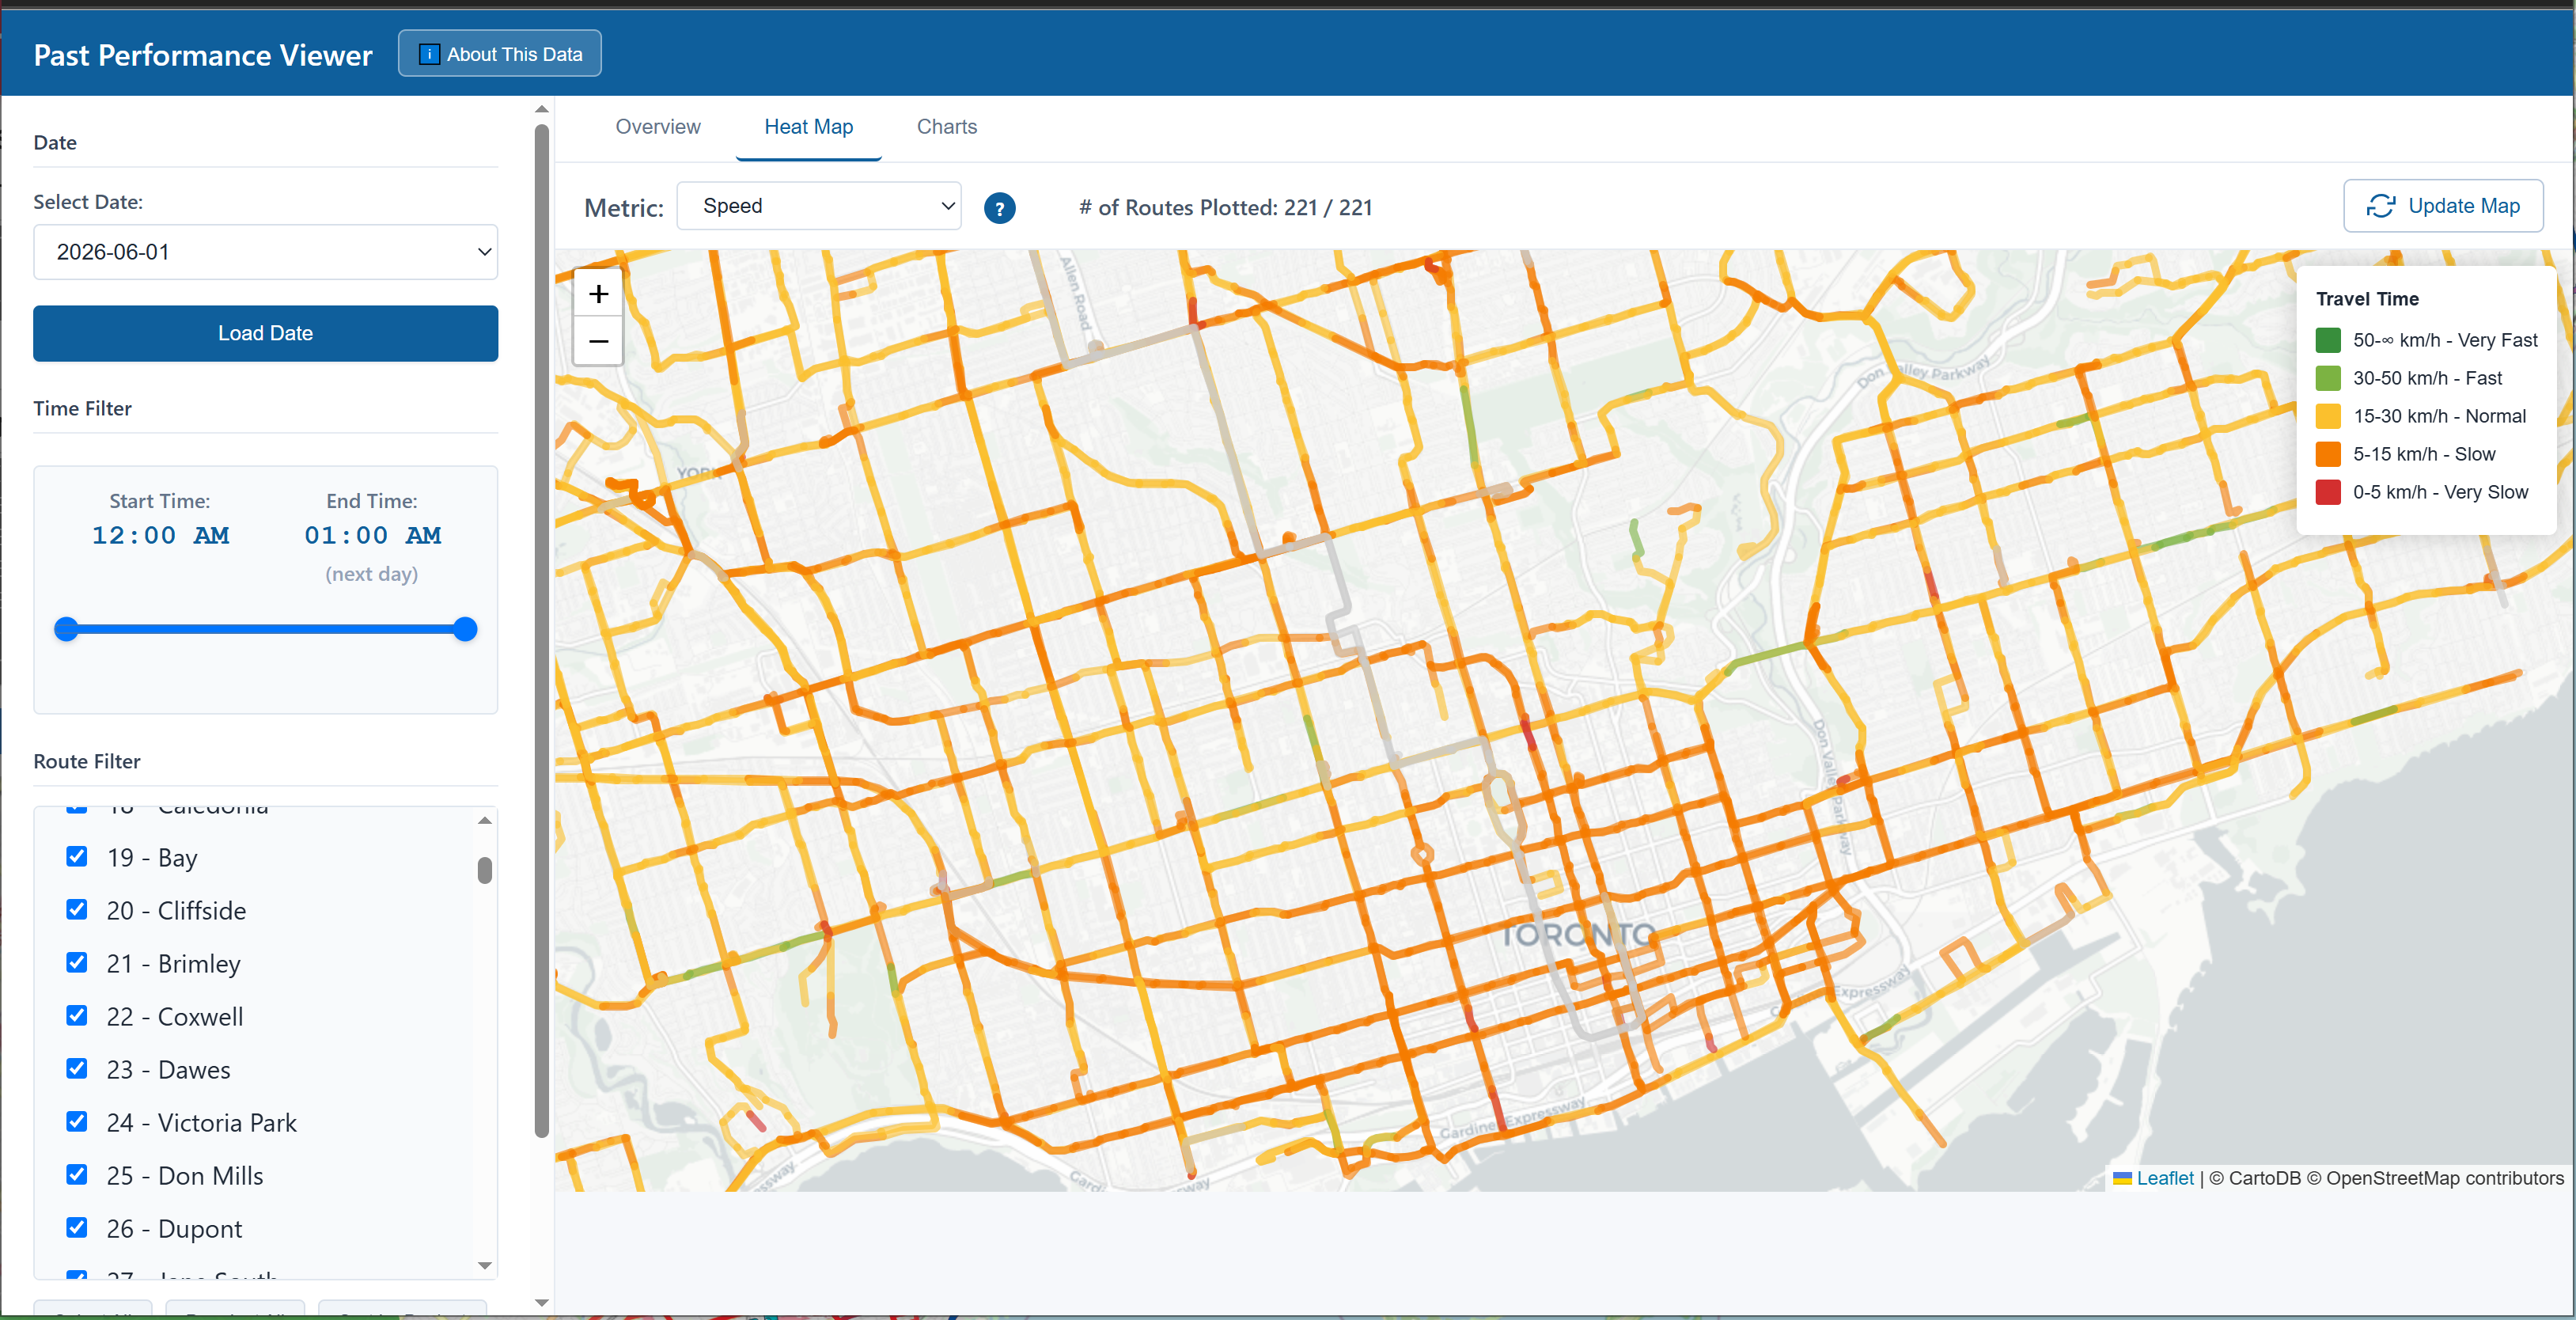
TransitBunny RT
TransitBunny RT records past transit performance for Vancouver and Toronto, and visualizes it through useful metrics such as on-time performance, speed, reliability, and headway regularity.
Features
- Live Vehicle Location
- Historical Route-Level Performance
- Performance Comparison Across Routes
- Heatmaps of Speed, Reliability, and Headway Regularity